03 / Academic project / Urban data / Walkability / 2025
Sydney green space.
A spatial data prototype for exploring parks and investigating walking connections.
The design question
Can park data become useful spatial information?
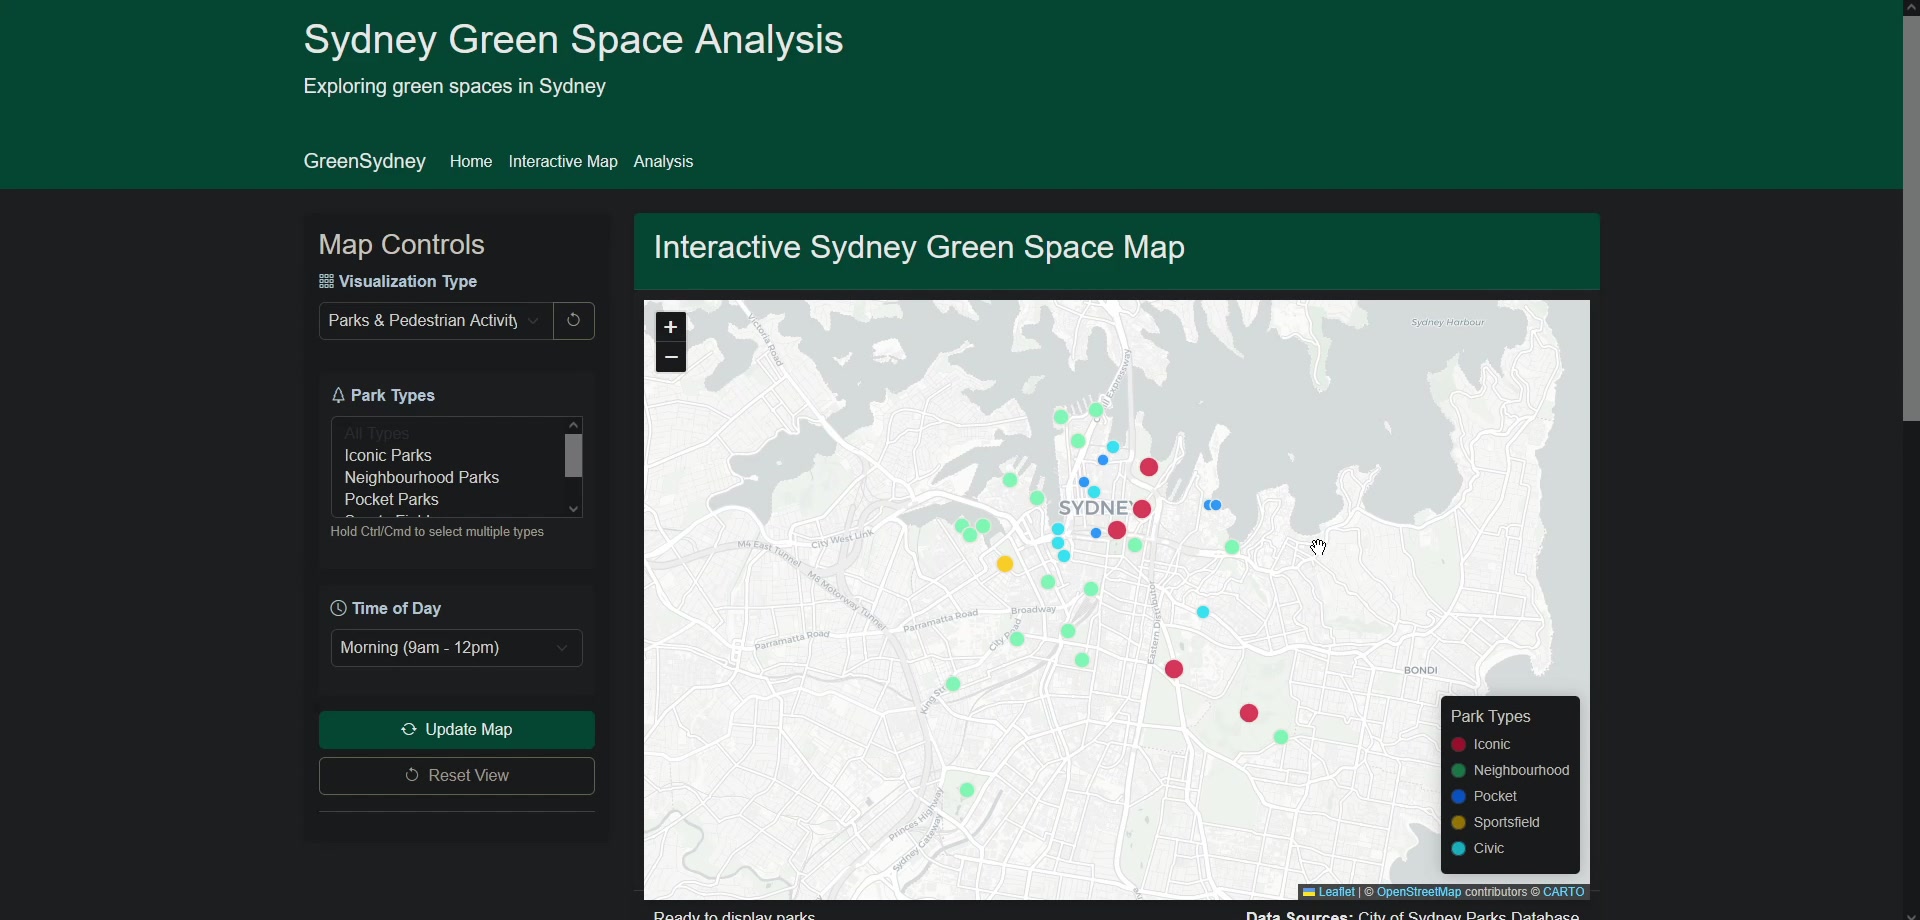
I brought park records into a Python and Flask application so locations, attributes and contextual questions could be explored together.
- Park map with filters and information panels
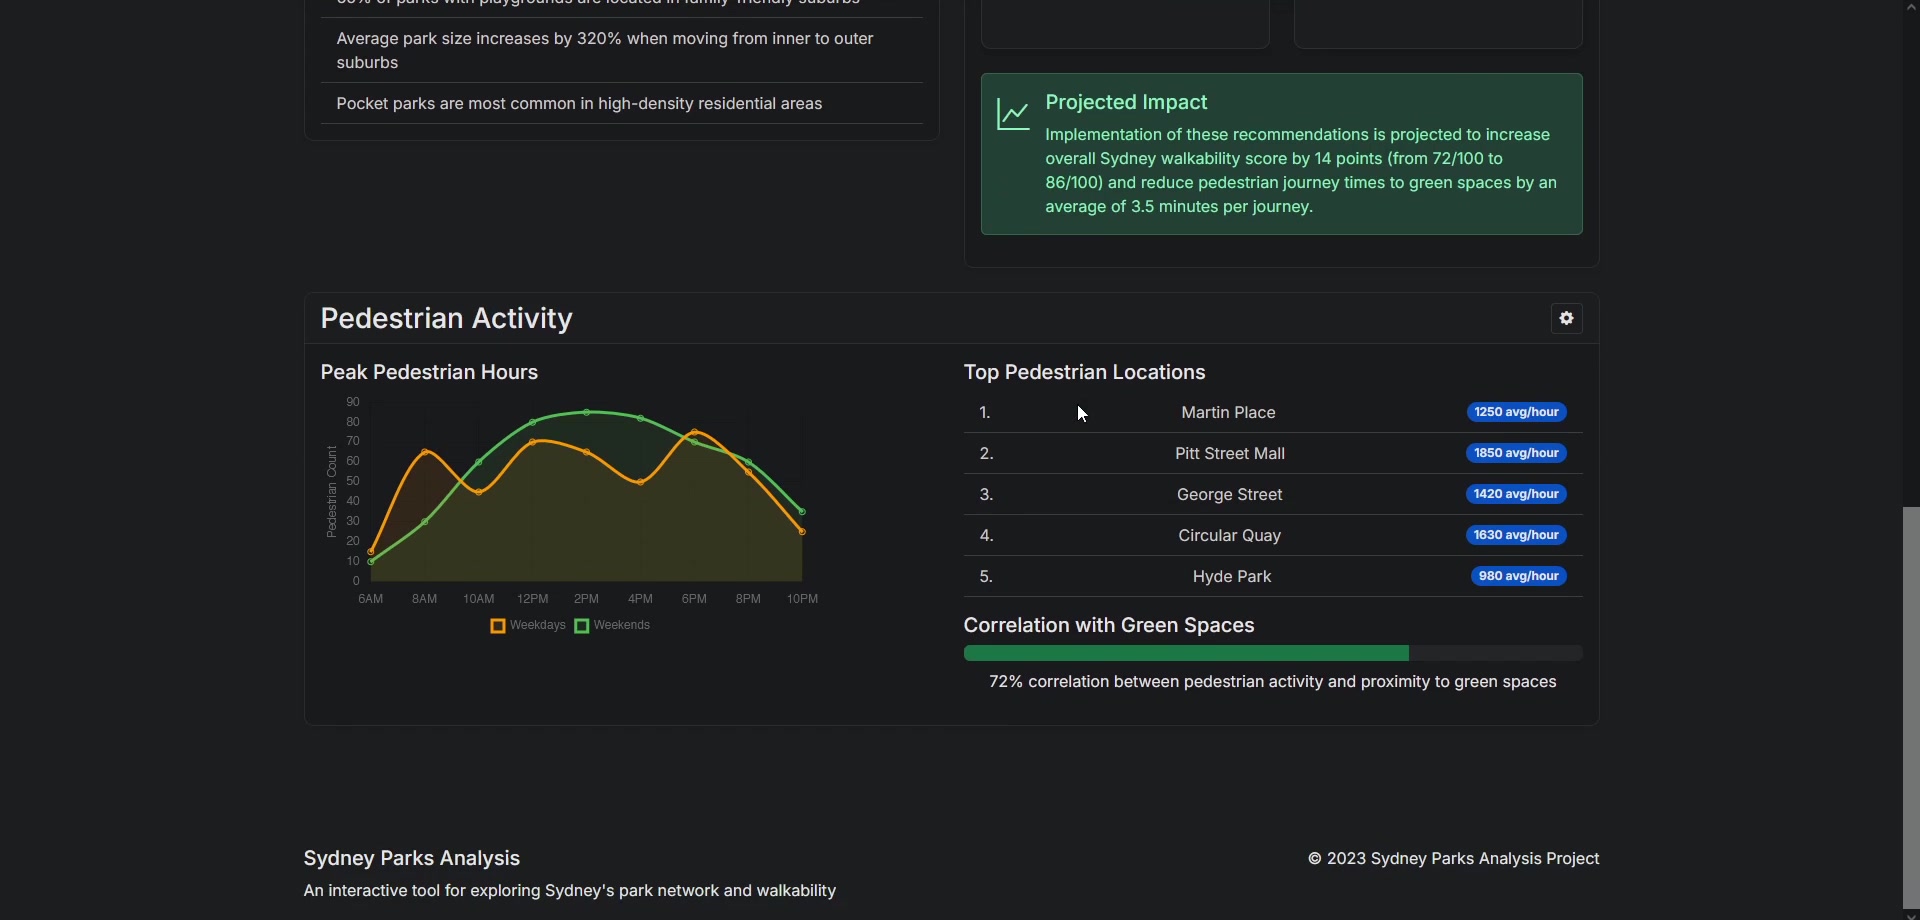
- Analysis dashboard and data-processing workflow
- Park-specific contextual question endpoint
Select an image to enlarge it and read its caption.
01 / Interface & analysis
Move from an overview to specific questions.
Filters and information panels let users focus on park attributes such as location, size and facilities. The analysis page presents charts and recommendations, while the question endpoint can incorporate the details of a selected park.
This demonstrates how a spatial dataset can be made easier to interrogate. It also shows why the origin of each indicator matters: pedestrian estimates in the prototype are synthetic, and walkability scores are derived rather than measured assessments.
02 / Data & system design
Build a path from records to an explorable map.
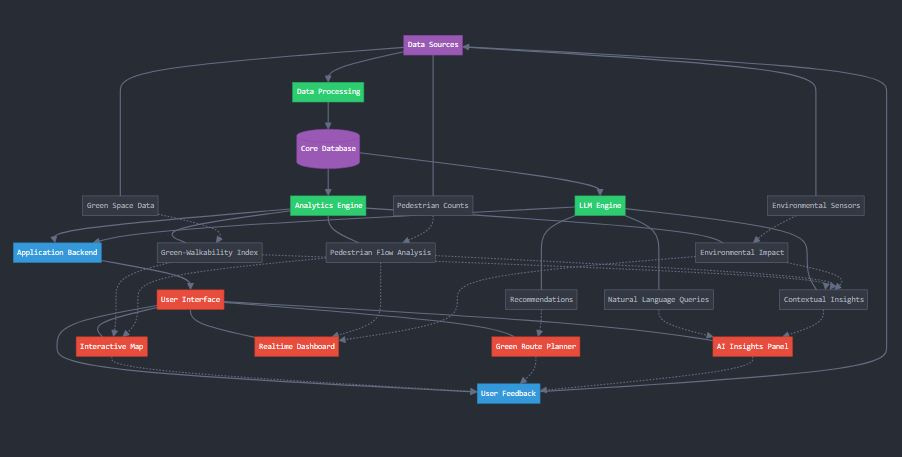
Python processing prepares park records for use by the application. A companion Google Places integration handles search, detail requests, enrichment and merging with local CSV records before exporting JSON.
The system diagram connects data acquisition with mapping, analysis and contextual questions. It is useful as an explanation of the intended architecture, while the screenshots and source demonstrate the prototype’s implemented components.
The data-enrichment script starts in test-data mode. The AI endpoint needs configured API access; this portfolio presents its design and implementation rather than a live assistant.
03 / Communication & limitations
Make the data’s status visible.
A credible urban dashboard needs to explain which information is sourced, estimated or simulated.
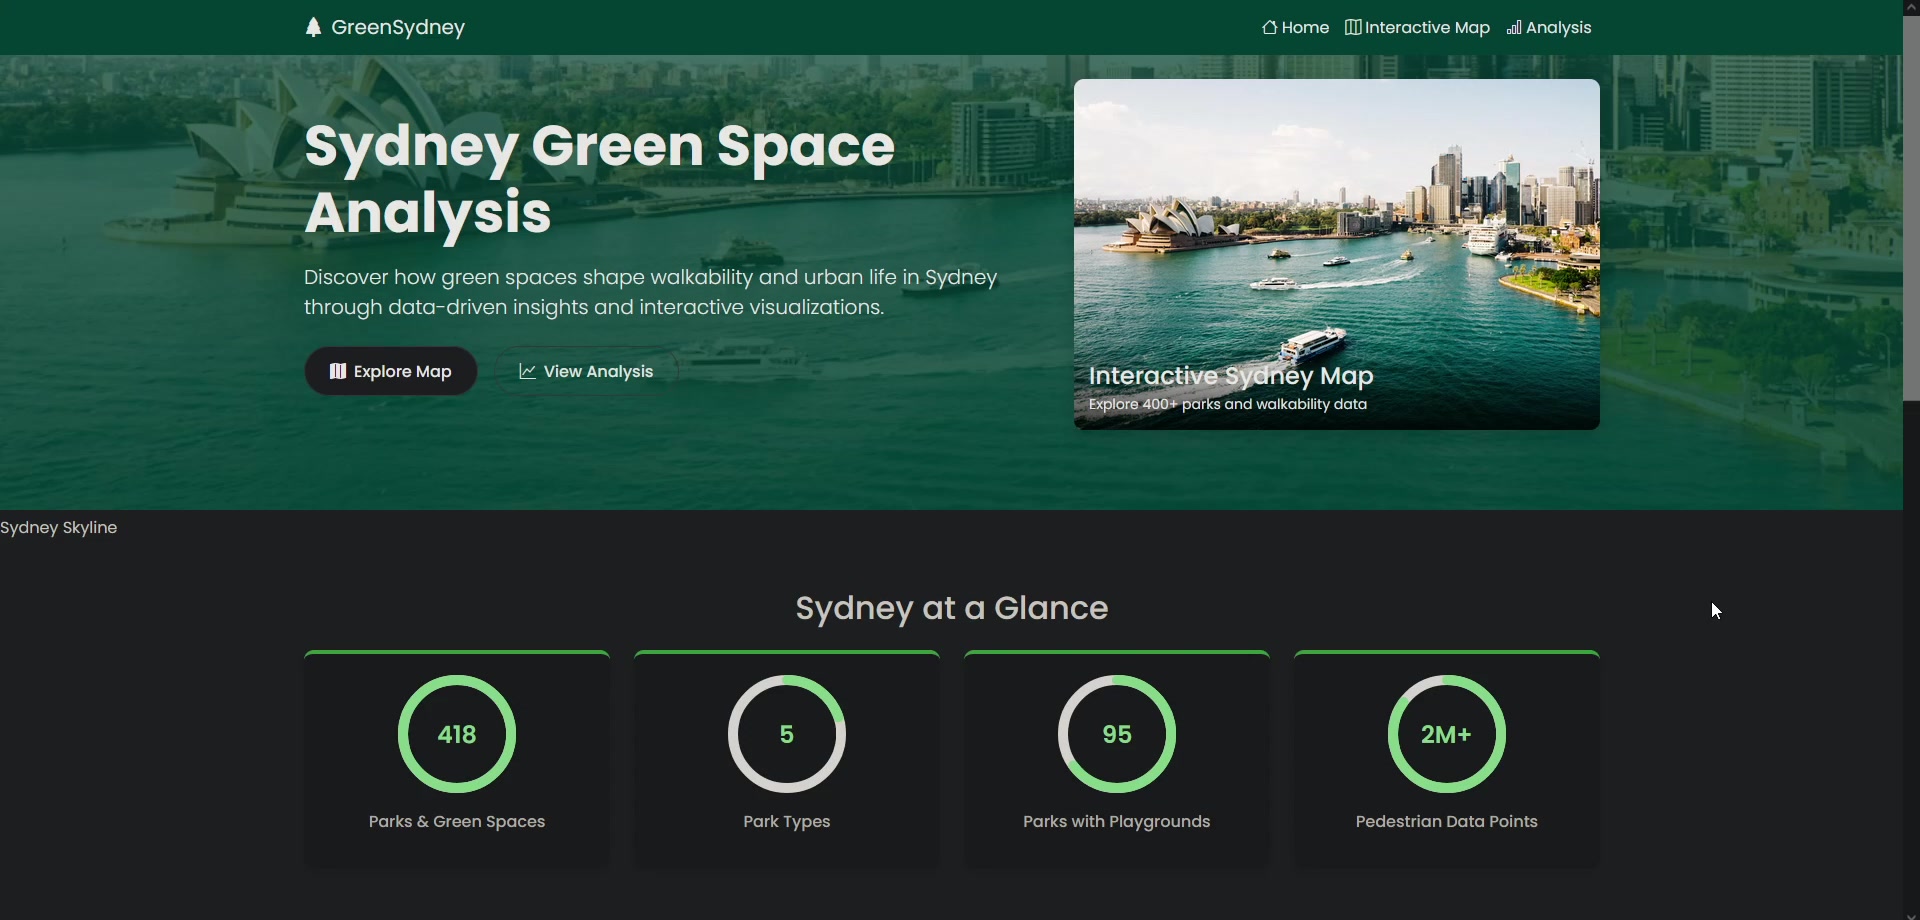
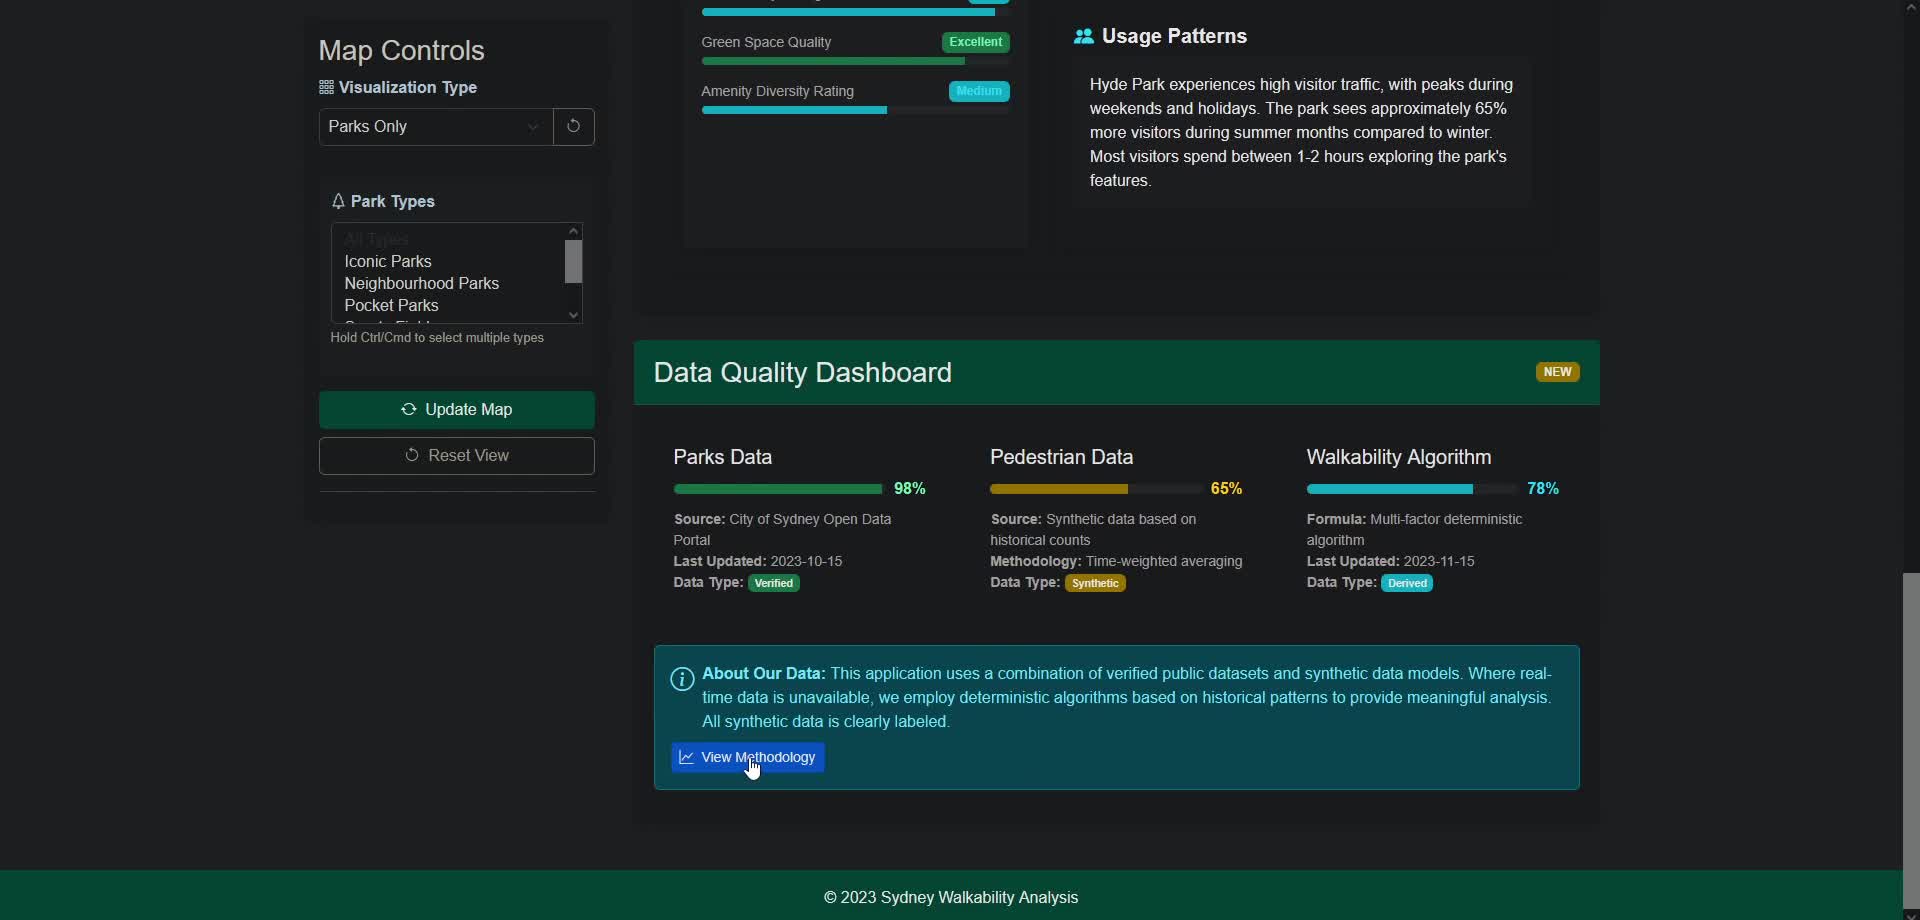
The outcome demonstrates how urban data can be processed and communicated through a spatial interface. Before informing decisions, a future version would need verified pedestrian observations, consistent access measures and testing with the people using the dashboard.