Prepare the network
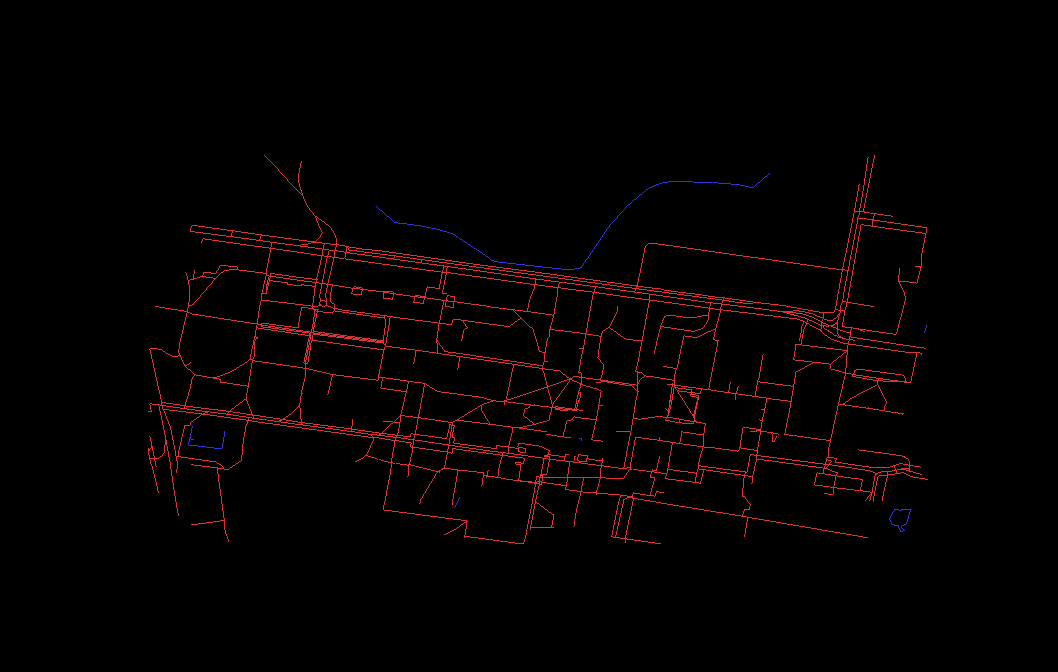
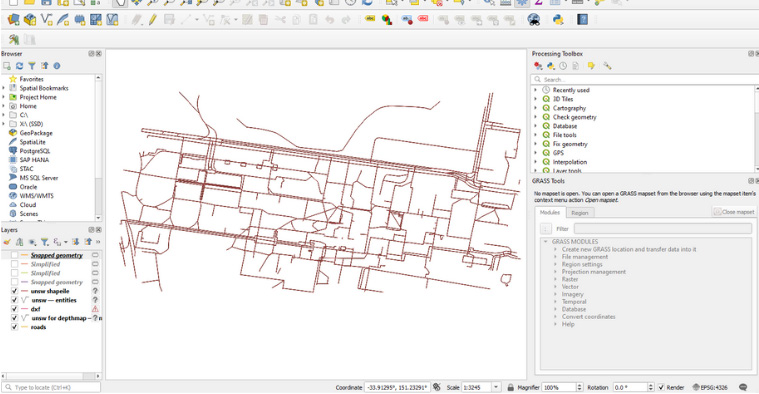
I extracted campus geometry from OpenStreetMap and cleaned it in QGIS to prepare paths for analysis.
01 / Graduation research / UNSW / 2025
Network research and a planning prototype for the UNSW campus.
The design question
I compared the UNSW path network with scheduled teaching activity, exploring where spatial structure helps explain use and where other factors matter.
Select an image to enlarge it and read its caption.
01 / Building the evidence
A connected network provides the basis for investigating how routes relate to destinations.
I extracted campus geometry from OpenStreetMap and cleaned it in QGIS to prepare paths for analysis.
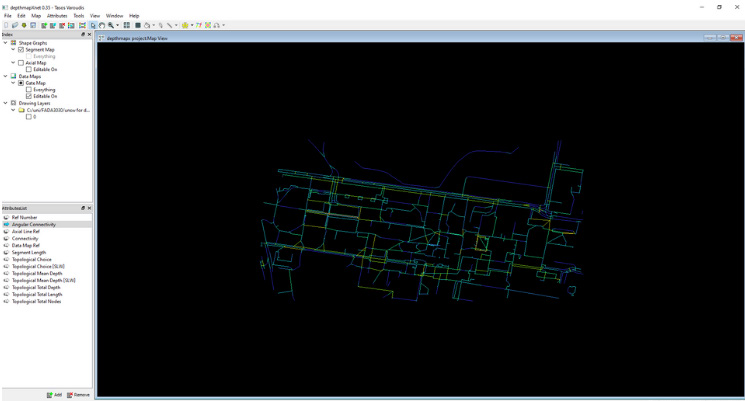
DepthmapX axial and segment analysis examined connectivity, integration and choice: different ways of describing how spaces relate within the network.
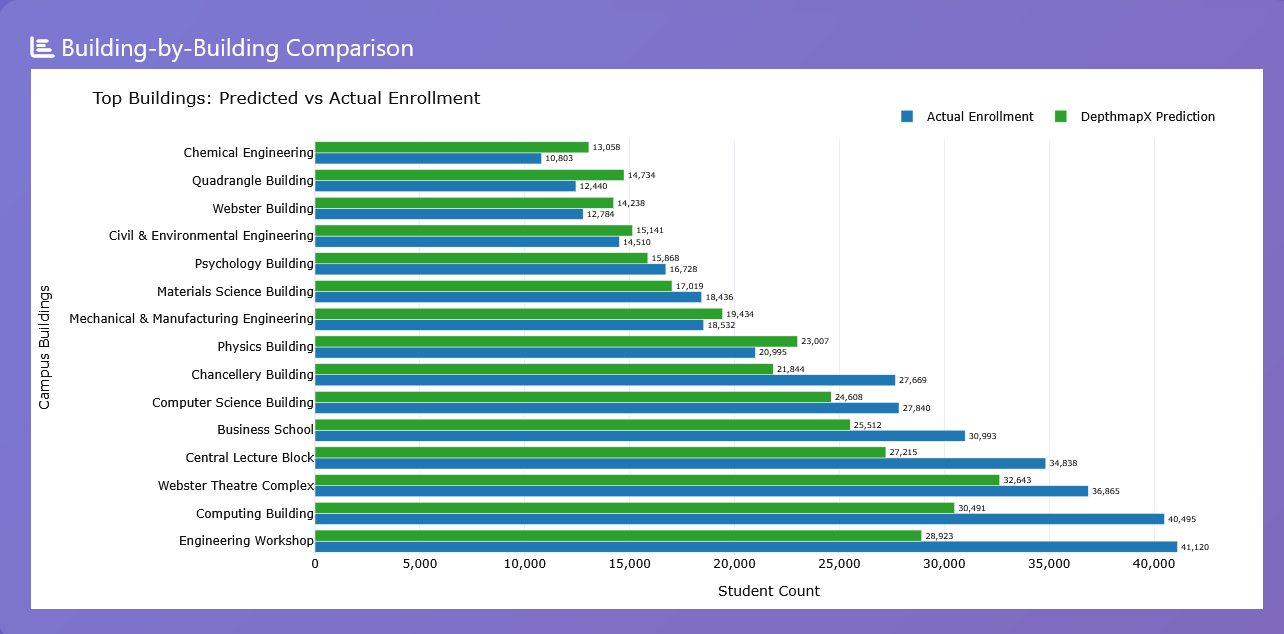
I compared the spatial measures with class meetings and enrolment patterns, then communicated the results through a Flask web platform.
02 / Findings & interpretation
The thesis reports correlations above 0.8 between spatial measures and scheduled activity for several building types. The relationship varies across the campus: teaching timetables represent lecture spaces more directly than laboratories, social spaces and food venues.
The planning implication is to read network structure alongside building function. A well-connected location is a useful starting point for investigation, but its expected use depends on what happens there and when.
Evidence scope: Term 2, 2025 timetable and enrolment records, rather than observed attendance or pedestrian counts. The correlations are reported thesis results; simulated planning indicators are illustrative.
03 / Translating the research
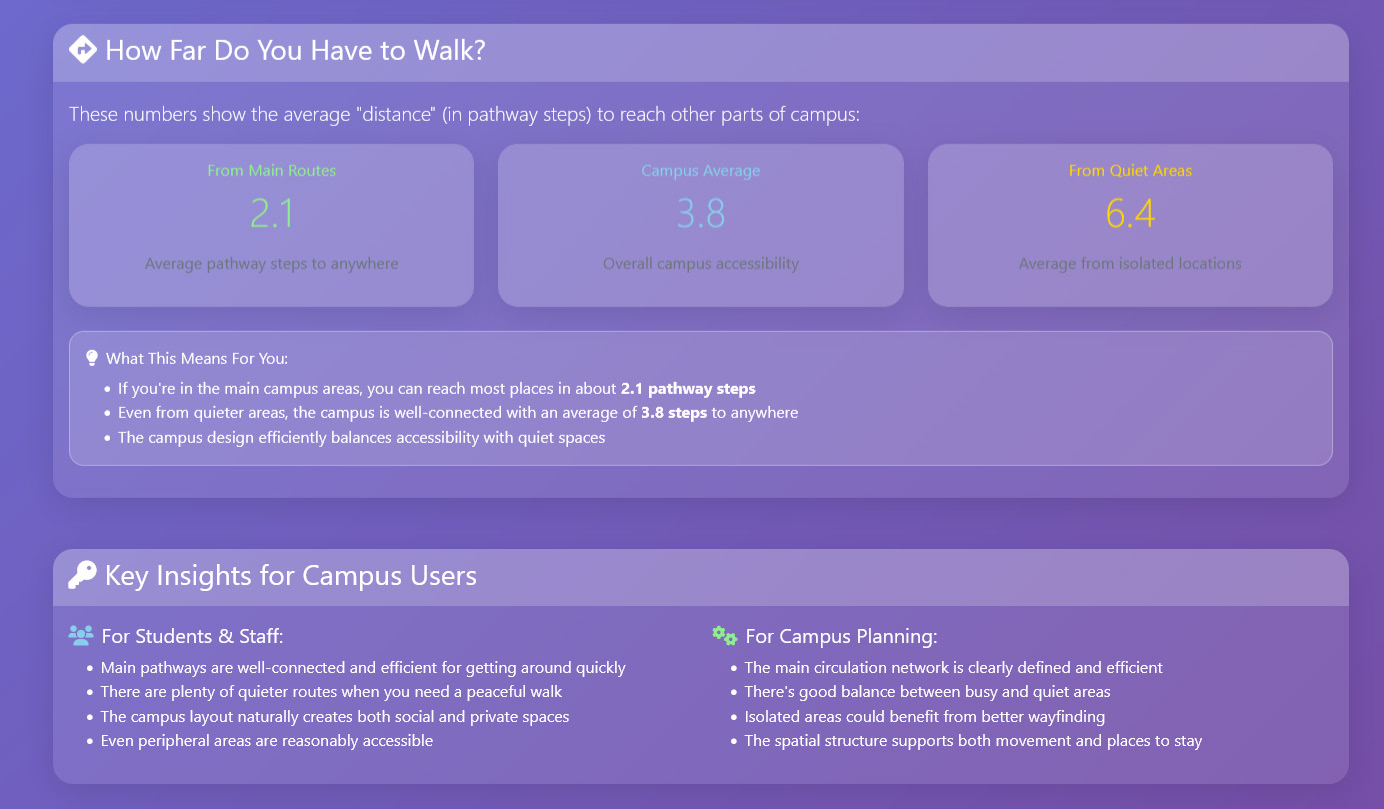
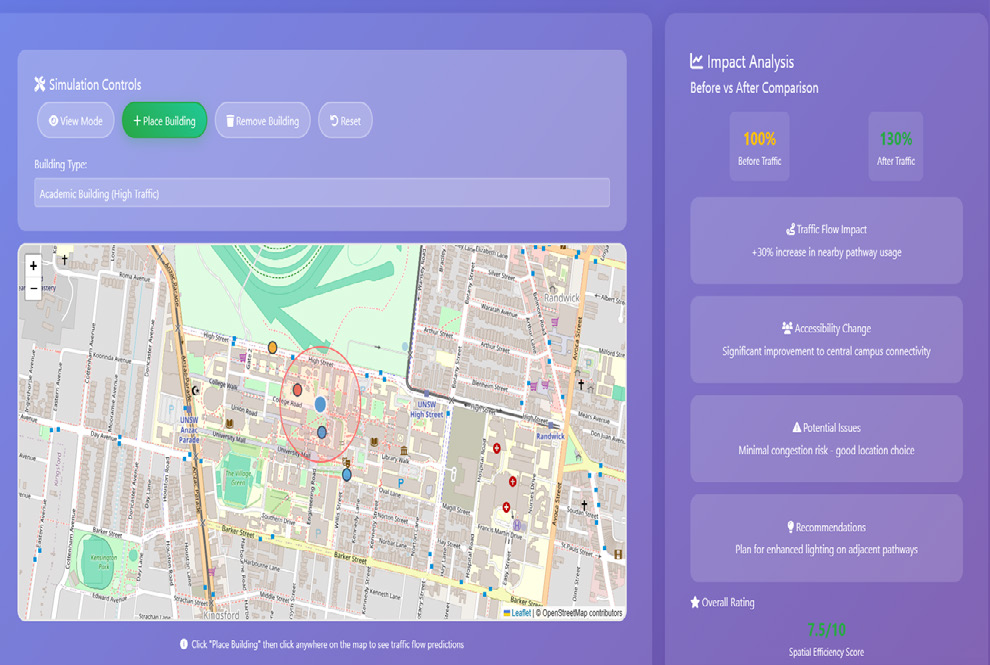
The platform extends the research beyond a technical network model. A building-placement interface allows users to explore locations in relation to surrounding routes, while guidance pages explain accessibility and wayfinding concepts.
This is the communication part of the project: helping a project team see the connection between a proposed intervention, its spatial context and the evidence still needed to assess it.
04 / Communicating access
Spatial analysis is more useful when its assumptions and meaning are understandable to planners and campus users.