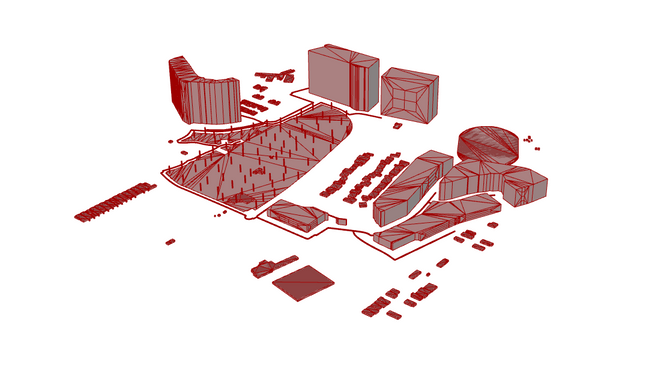
Direction A
Balanced
A baseline for discussing development and planting together.
Building massModerateSize input 5.0 / 10 · inverse scale
Trees50 / 100
Tree height10 / 20 m
02 / Academic project / Urban design / Green infrastructure
An adjustable neighbourhood model for exploring built form, park access and sunlight.
The design question
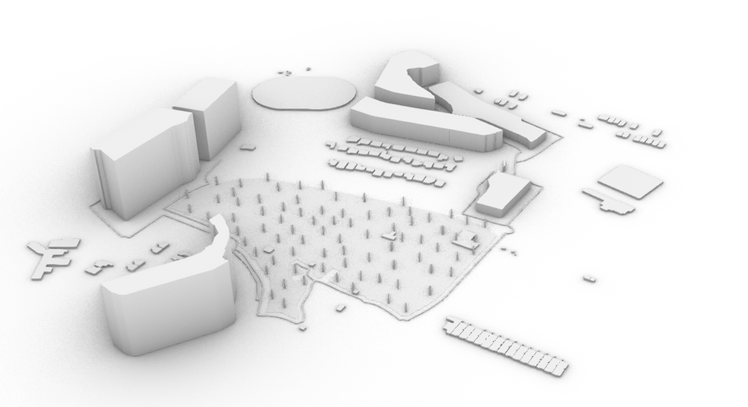
I explored the relationship between buildings, a central park, tree cover and access through an adjustable neighbourhood model, supported by a separate sunlight study.
Select an image to enlarge it and read its caption.
01 / Modelling approach
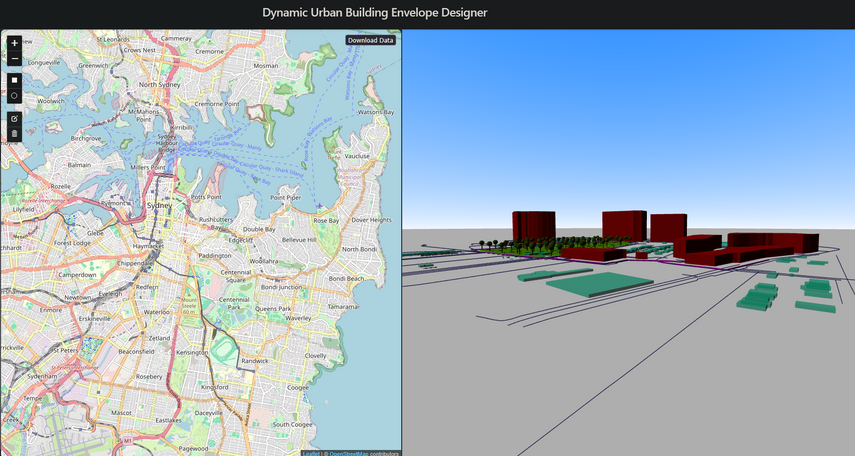
I used Grasshopper to control building size, building filtering, tree quantity and tree height. The browser interface exposes these inputs so the effects can be viewed alongside a map of the area.
This connects geometric modelling with communication. Instead of presenting only a final image, the workflow makes it possible to discuss which variables produced a particular arrangement and how another direction might change it.
02 / Design exploration
Three documented parameter sets, followed by model views. The bars compare inputs, rather than predicted environmental performance.
Direction A
A baseline for discussing development and planting together.
Direction B
Explore greater building mass with fewer, shorter trees.
Direction C
Explore smaller building footprints with more, taller trees.
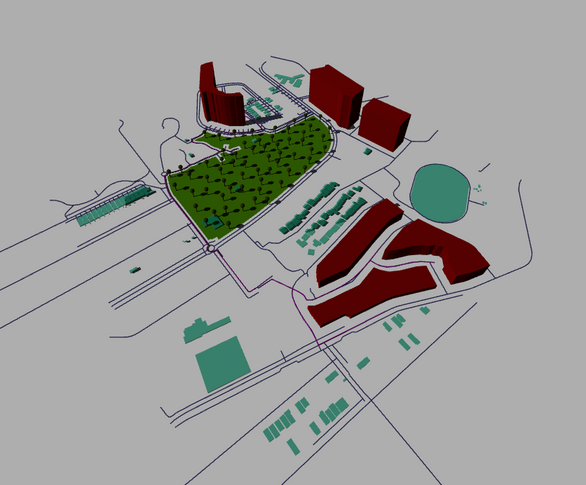
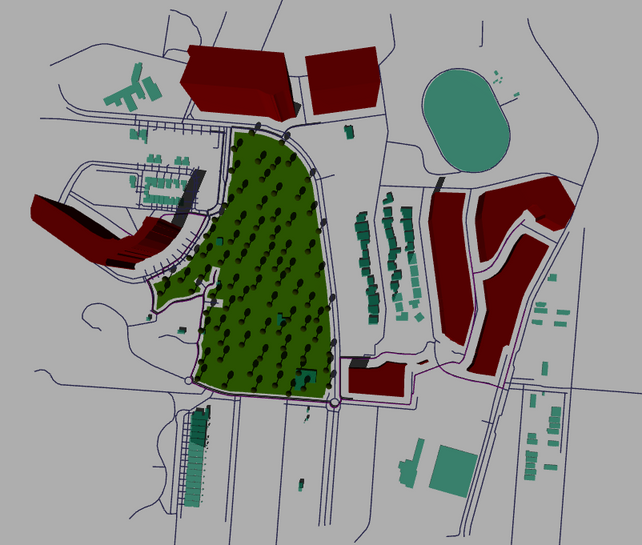
The inverse building-size input is important: 2.0 produces larger footprints, while 8.0 produces smaller footprints. Comparing the settings makes the design priorities explicit; it does not establish which option performs best. Testing each option against the same access and environmental criteria would be the next step.
03 / Access to the park
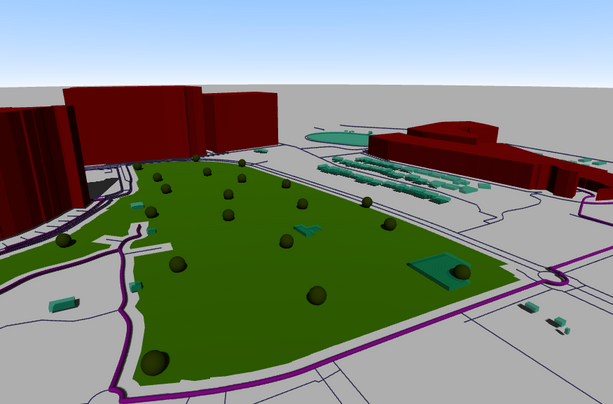
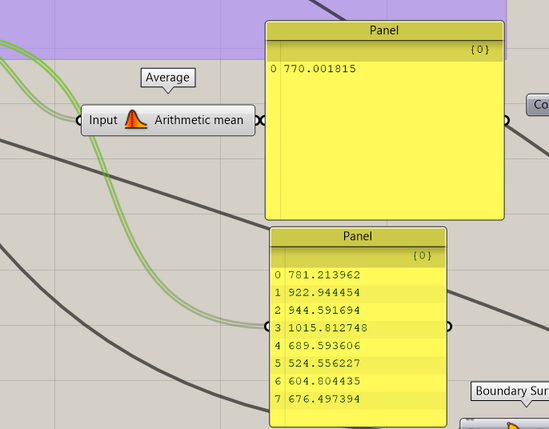
The Grasshopper shortest-path study reports a mean route length of approximately 770 m from the selected residential buildings to the central park. This gives the access question a measurable starting point.
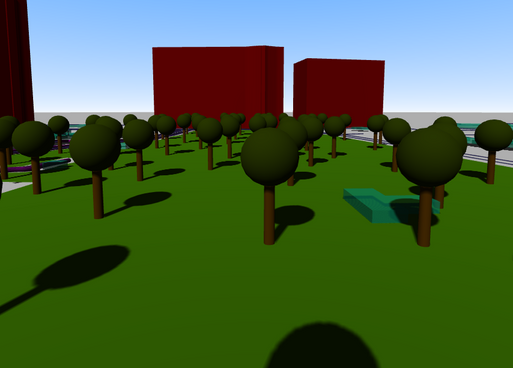
Distance alone does not establish accessibility. Entrances, crossings, gradients and the continuity of usable paths would also need to be checked. The street-level view helps relate the network study to the surrounding buildings and trees.
04 / Environmental analysis
Direct sun-hours analysis in Sydney across the January–July study period.
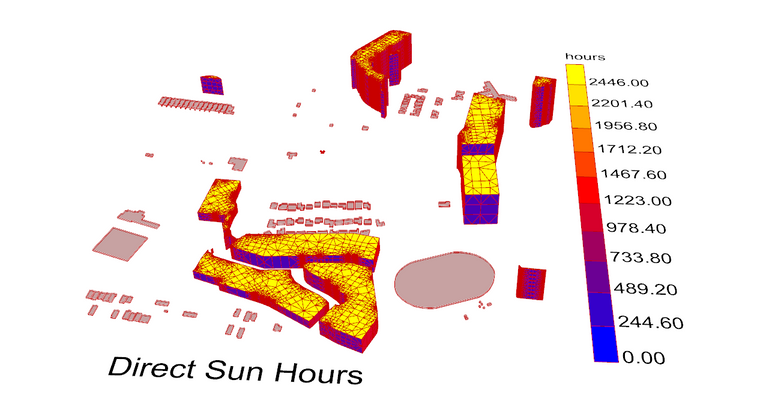
The sunlight study adds an environmental view to the geometric comparison. It allows exposure patterns to be considered alongside building mass and tree placement, helping frame questions about where shade or sun access should be investigated.
This analysis remained separate from the web application because of performance limits. It is a model study, and further testing would be needed before using it to support comfort targets or planning decisions.
05 / Reading the model
Two representations explain different aspects of the same design workflow.